_811205.png)
_e196d8.png)
_32b3d9.png)
_1c53fe.png)

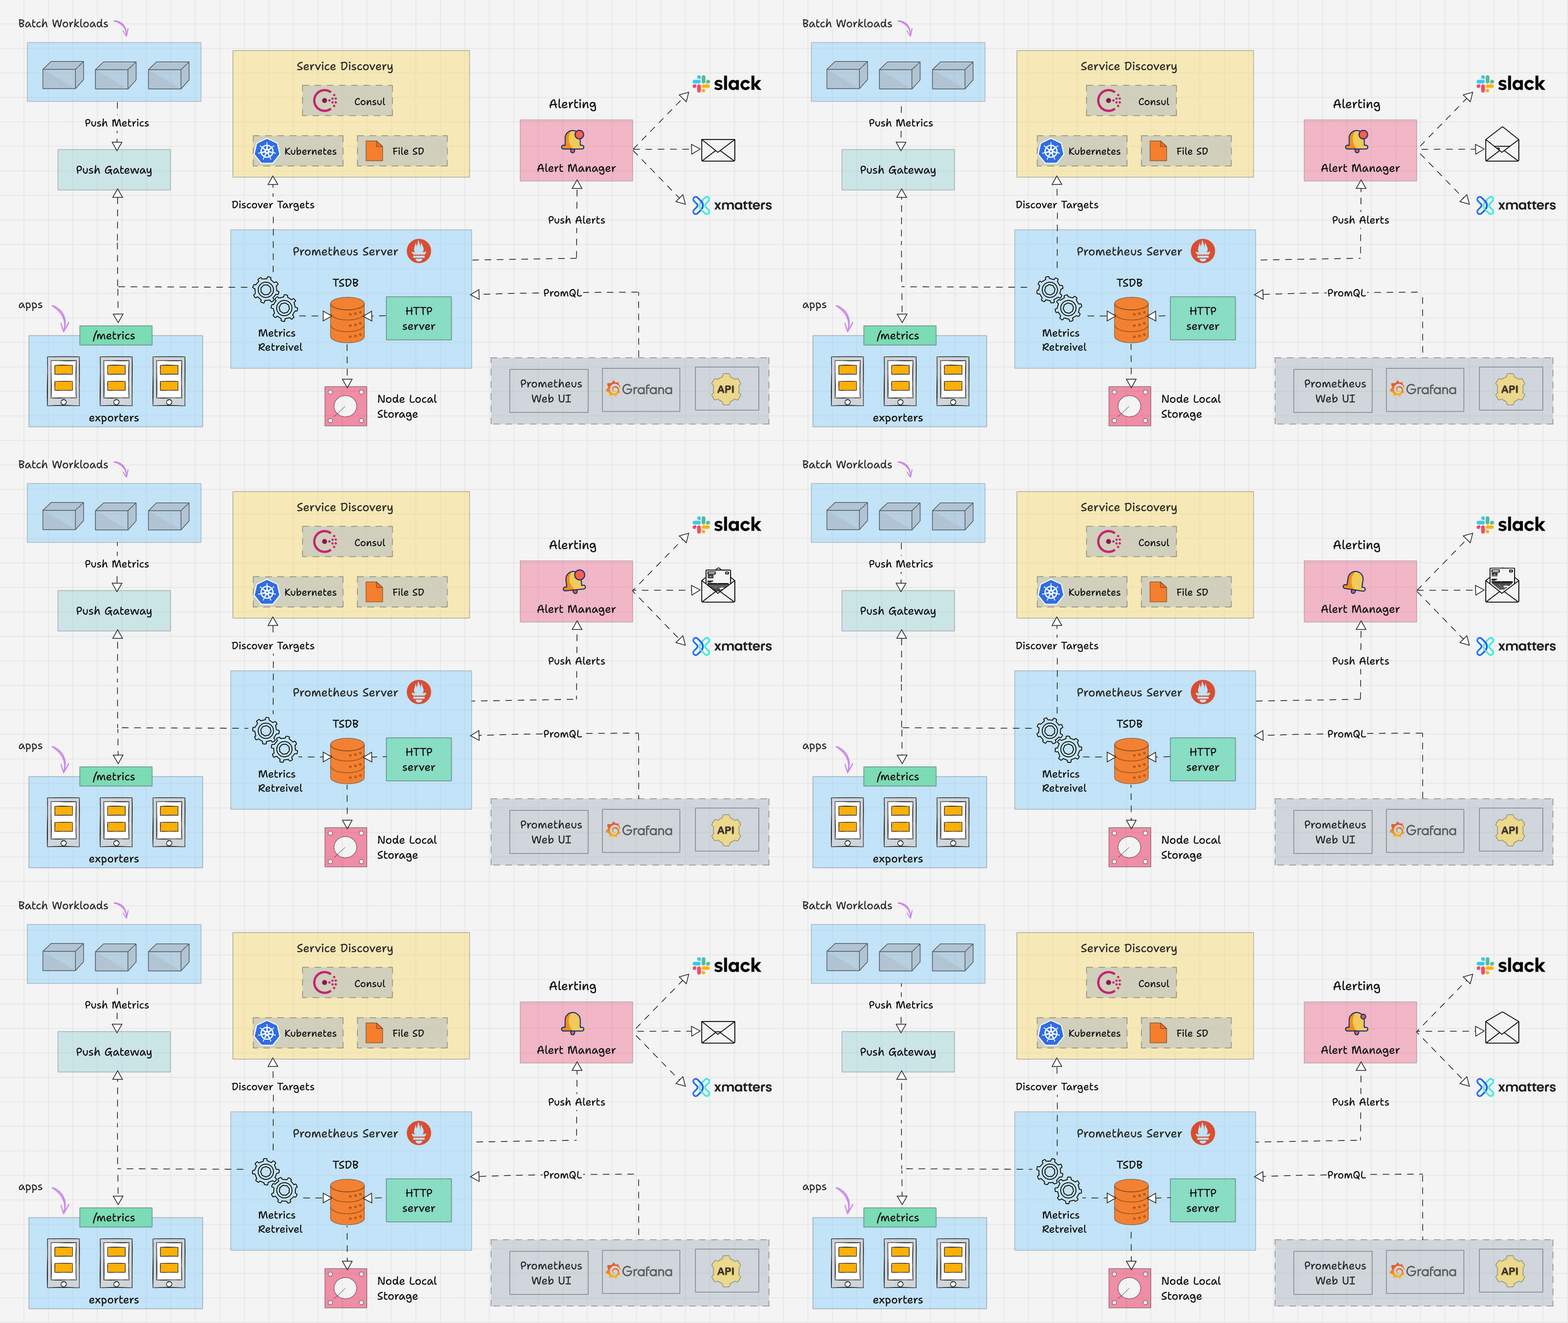
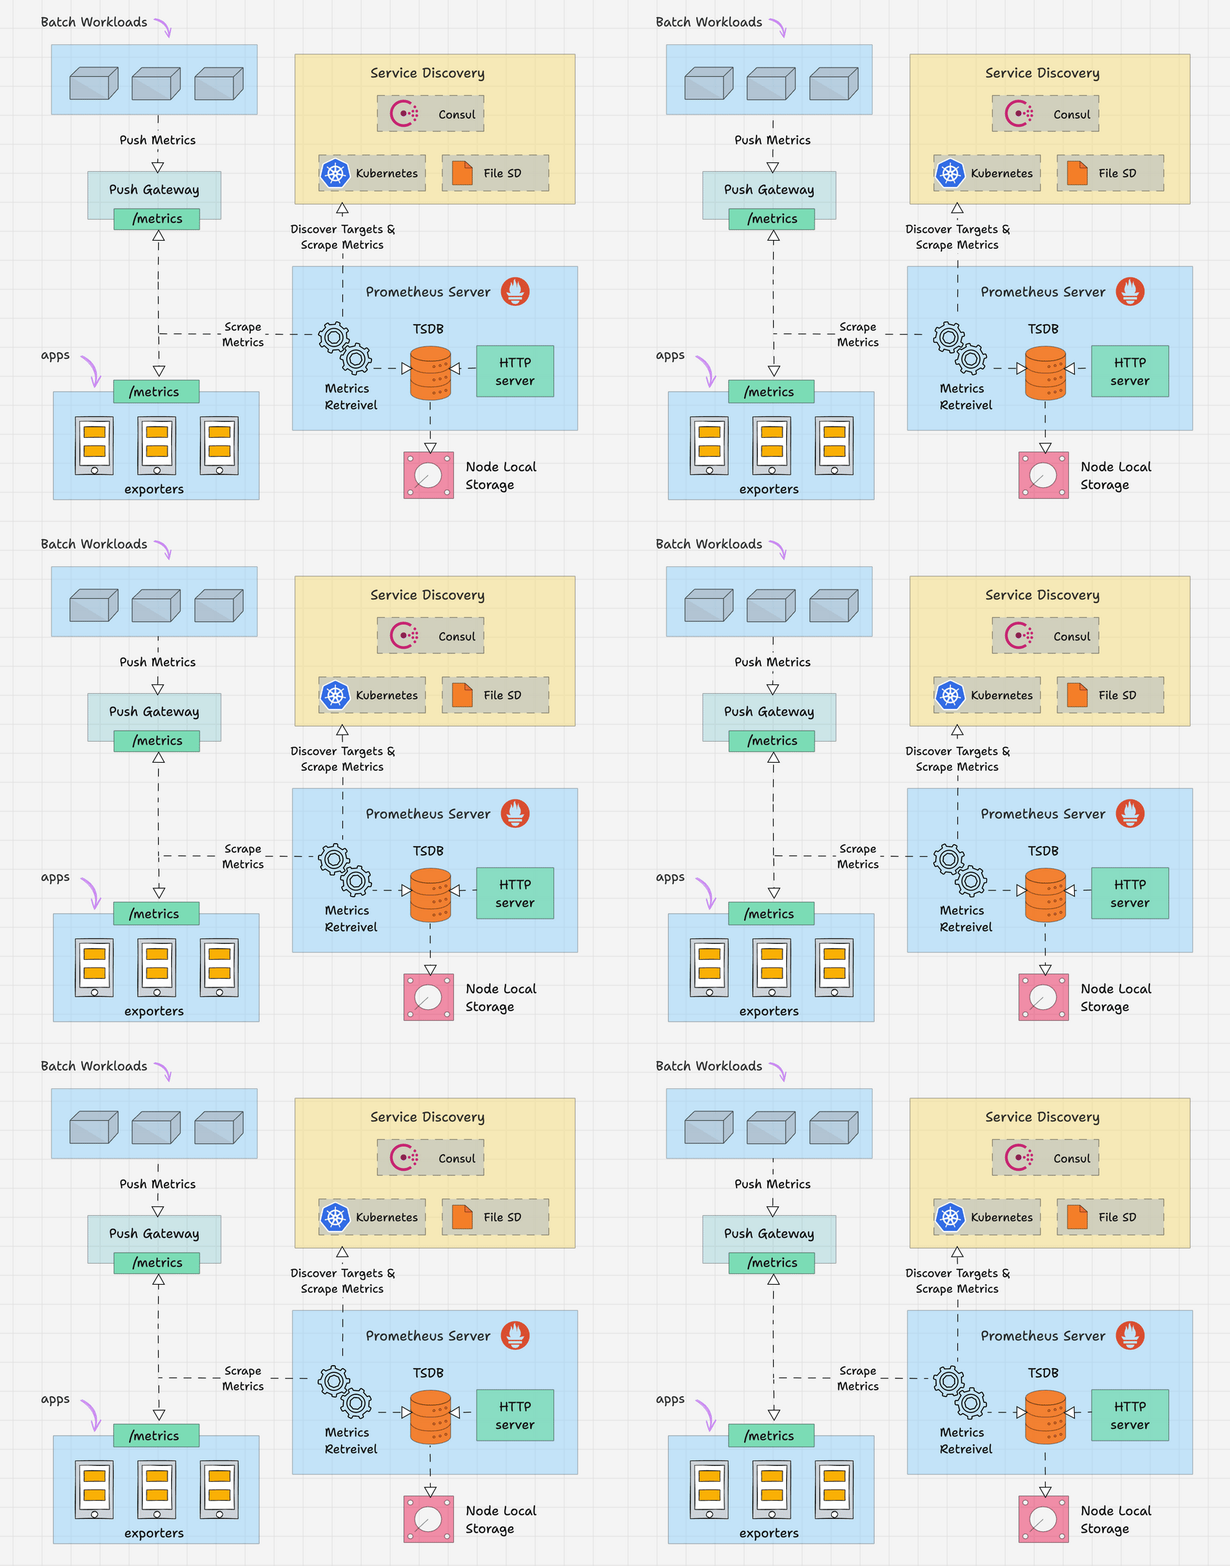
1️⃣ What is Prometheus?
Prometheus is an open-source monitoring and alerting system designed primarily for cloud-native and Kubernetes environments, but it works equally well with VMs, bare-metal servers, and applications.
Key Characteristics
- ✅ Monitoring Tool
- ✅ Database
- ✅ Time-Series Database (TSDB)
- ✅ Cloud-native & Kubernetes core component
- ✅ Written in Go
- ✅ Runs on any OS
- ✅ Pull-based architecture
- ✅ Highly scalable & reliable
2️⃣ Prometheus as a Time-Series Database
Prometheus stores data as time-series, meaning every data point is associated with a timestamp.
Time-Series Format
(timestamp, metric_name, value, labels)
Example
| Timestamp (epoch) | Metric | Value | Labels |
|---|---|---|---|
| 1700000000 | cpu_usage | 32 | name=”cpuserver1″ |
➡️ Each metric can have multiple labels, making Prometheus extremely powerful for filtering and aggregation.
3️⃣ Why Prometheus is Popular
- Designed for modern microservices
- Excellent label-based querying
- Strong Kubernetes integration
- Simple architecture (no external DB needed)
- Large exporter ecosystem
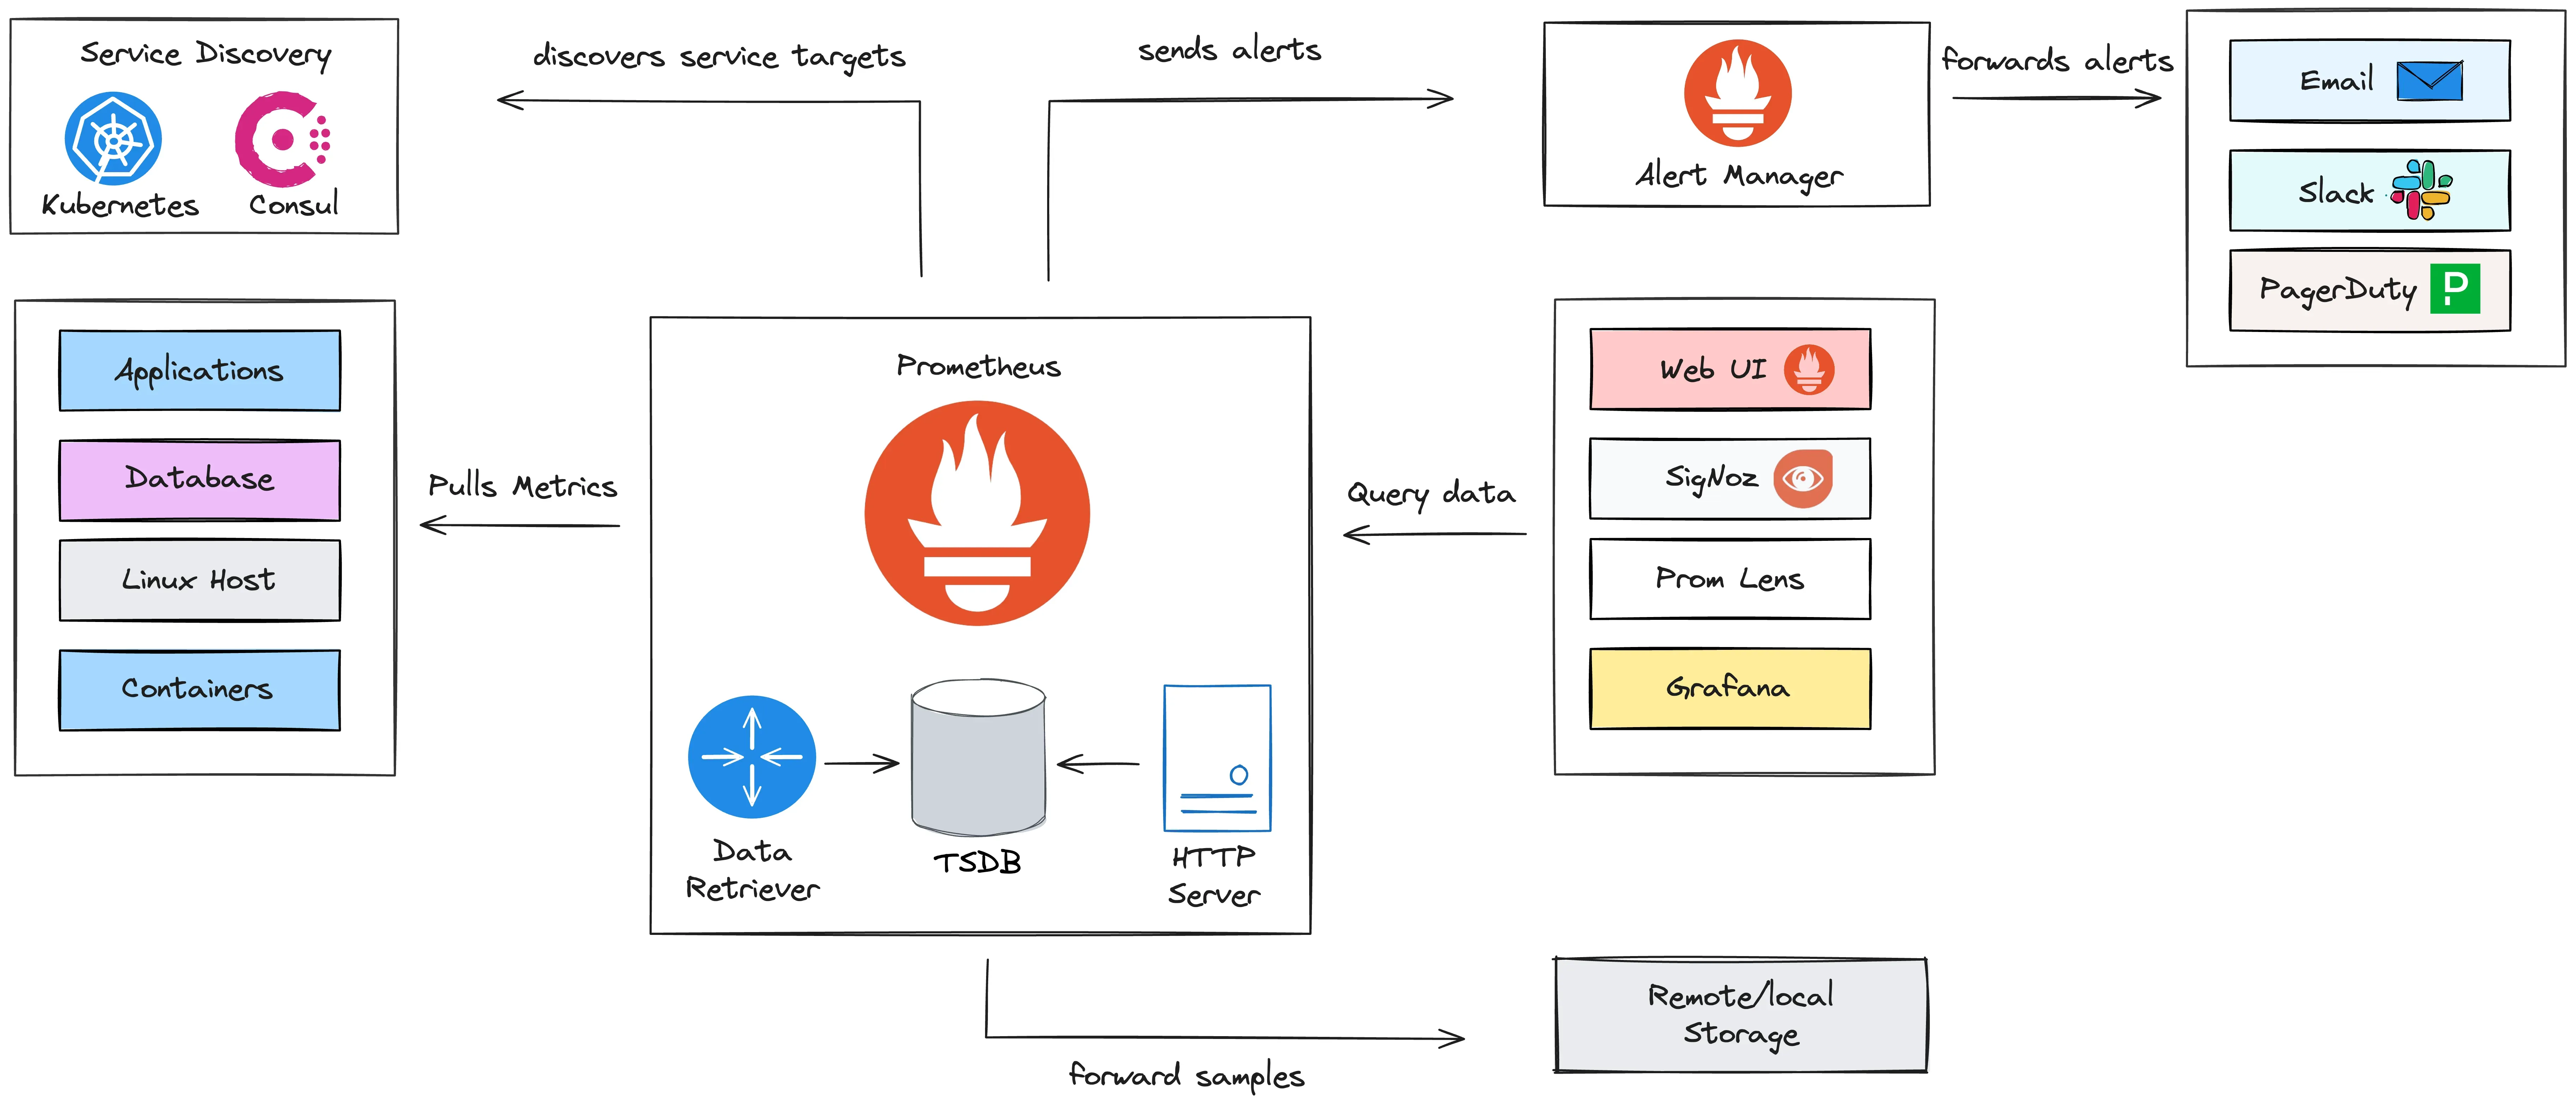
4️⃣ Architecture & Core Components of Prometheus

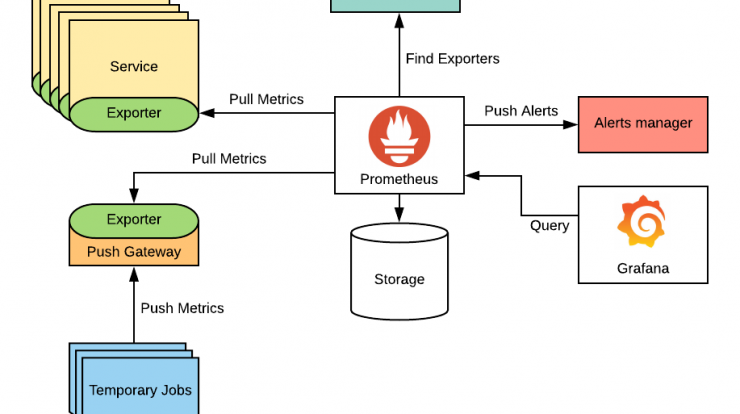
🔹 1. Prometheus Server
This is the heart of the system.
It includes:
- Time-Series Database (TSDB)
- PromQL Engine – query language
- Alerting Rules Engine
- Web UI (Expression Browser)
- Pull Mechanism (scrapes metrics)
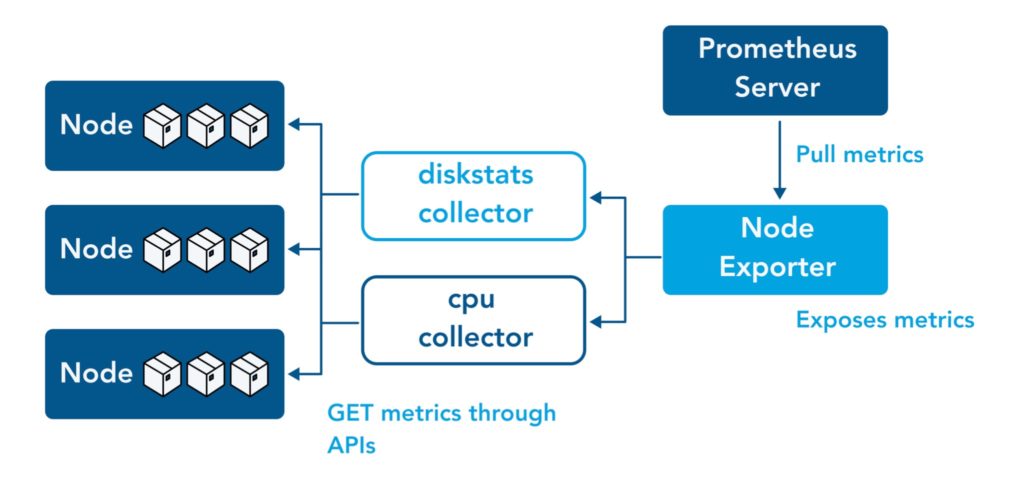
🔹 2. Exporters
Exporters expose metrics in a Prometheus-friendly format.
Examples:
- Node Exporter – Linux OS metrics
- Blackbox Exporter – HTTP, ICMP, TCP checks
- MySQL Exporter
- Nginx Exporter
📌 Exporters run on targets, not on Prometheus itself.
📘 Official exporter list:
https://prometheus.io/docs/instrumenting/exporters/
🔹 3. Client Libraries
Used when applications expose their own metrics.
Supported languages:
- Go
- Java
- Python
- Node.js
- .NET
🔹 4. Alertmanager
Handles alerts sent by Prometheus.
Functions:
- Deduplication
- Grouping
- Routing
- Notifications (Email, Slack, PagerDuty, etc.)
5️⃣ How Prometheus Works (Pull vs Push)
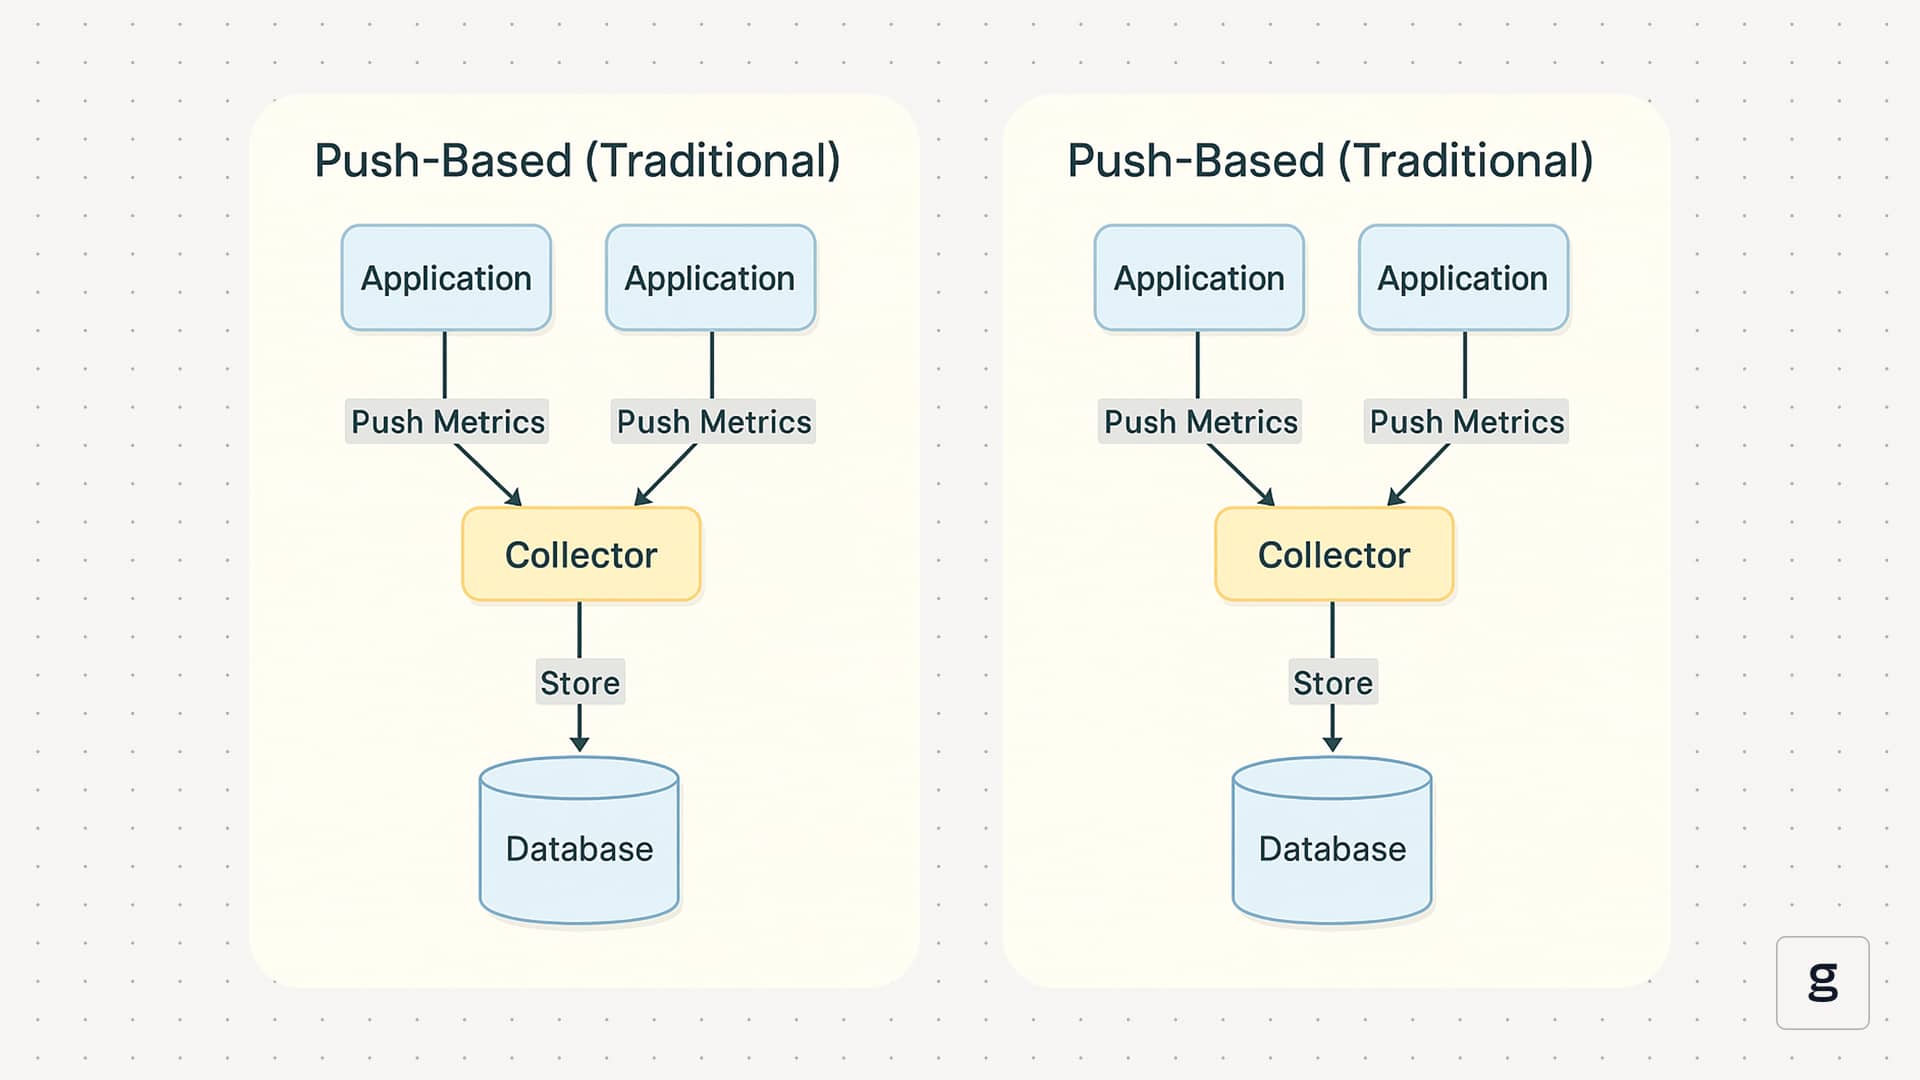
Pull-Based Model (Default)
- Prometheus pulls metrics from targets
- Targets expose
/metrics - Prometheus decides:
- When to scrape
- How often
- Which targets
✅ Better control
✅ Easier debugging
✅ Secure & scalable
⚠️ Push is only used in special cases (via Pushgateway)
6️⃣ Getting Started – Hands-On Setup
✅ Step 1: Install & Start Prometheus Server (DONE)
Download:
https://prometheus.io/download/
Reference Guide:
https://www.devopsschool.com/blog/install-and-configure-prometheus-server-and-node-exporter-in-rhel/
Access Prometheus UI:
http://43.205.98.212:9090
✅ Step 2: Setup Node Exporter on Linux Servers (DONE)
Node Exporter exposes system metrics like:
- CPU
- Memory
- Disk
- Network
- Load
Example metrics endpoint:
http://43.205.98.212:9100/metrics
✅ Step 3: Configure Scraping for Linux Servers
Targets:
http://43.205.98.212:9100
http://43.205.98.213:9100
http://43.205.98.214:9100
🔧 Add Linux Job in prometheus.yml
scrape_configs:
  - job_name: "linux-nodes"
    static_configs:
      - targets:
          - "43.205.98.212:9100"
          - "43.205.98.213:9100"
          - "43.205.98.214:9100"
        labels:
          env: "production"
          role: "linux-server"
Reload Prometheus:
kill -HUP <prometheus_pid>
or restart service.
✅ Step 4: Visualize Metrics Using Expression Browser
Open:
http://43.205.98.212:9090
Example PromQL Queries
CPU Usage
rate(node_cpu_seconds_total{mode!="idle"}[5m])
Memory Usage
node_memory_MemAvailable_bytes
Disk Usage
node_filesystem_avail_bytes
📘 PromQL Examples:
- https://www.devopsschool.com/blog/prometheus-promql-example-query/
- https://www.devopsschool.com/blog/prometheus-promql-example-query-node-exporter/
7️⃣ Summary – Prometheus at a Glance
| Feature | Description |
|---|---|
| Storage | Built-in Time-Series DB |
| Data Model | Metric + Labels |
| Collection | Pull-based |
| Query Language | PromQL |
| Visualization | Built-in UI + Grafana |
| Alerts | Prometheus + Alertmanager |
| Cloud Native | Kubernetes native |
8️⃣ What to Learn Next 🚀
- PromQL (Advanced queries)
- Alert Rules & Alertmanager
- Grafana Dashboards
- Prometheus in Kubernetes
- Federation & Remote Storage
Recommended Comments
Join the conversation
You can post now and register later. If you have an account, sign in now to post with your account.