_811205.png)
_e196d8.png)
_32b3d9.png)
_1c53fe.png)

Synthetic Monitoring – Complete Guide
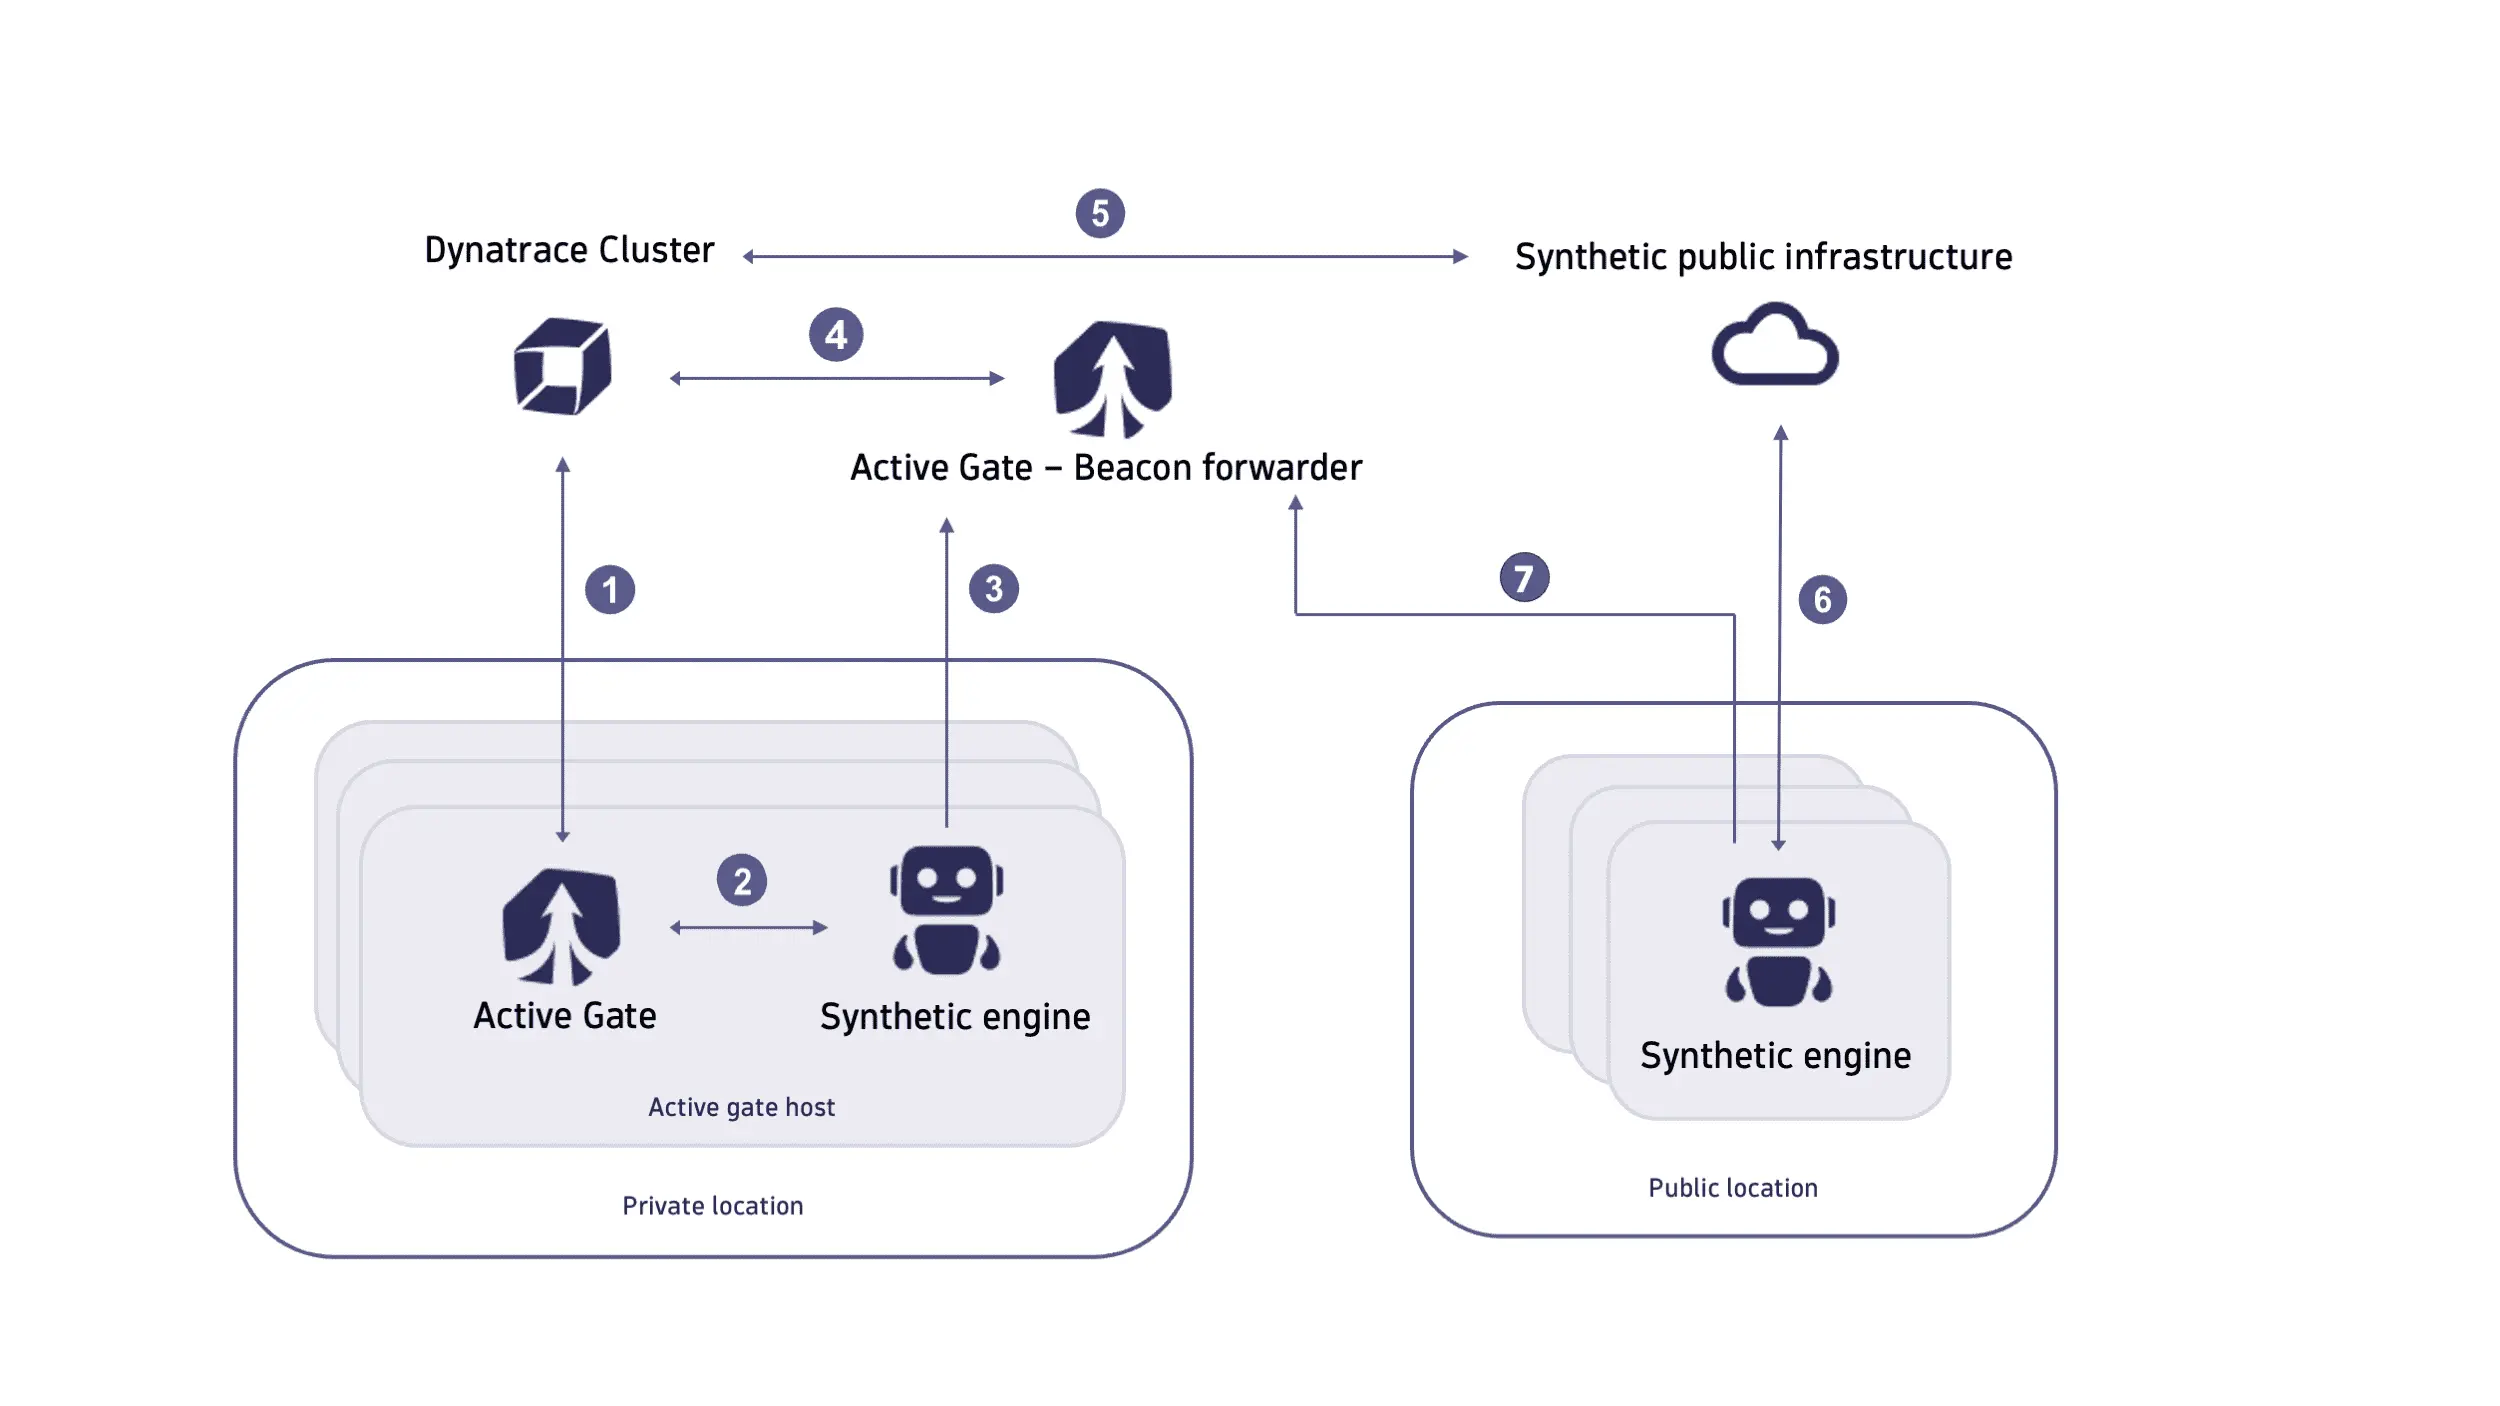
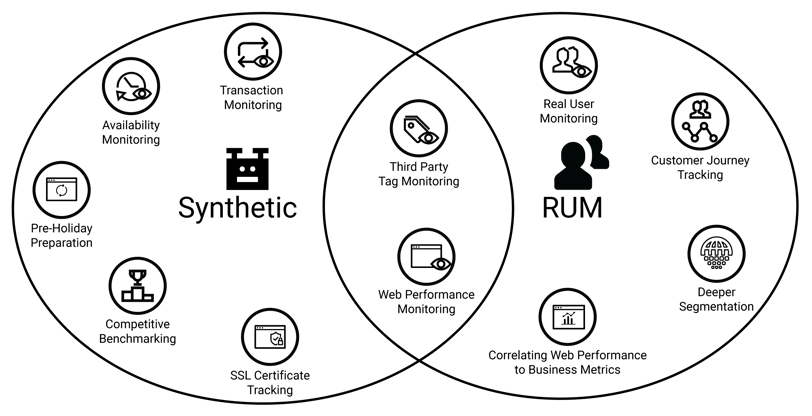

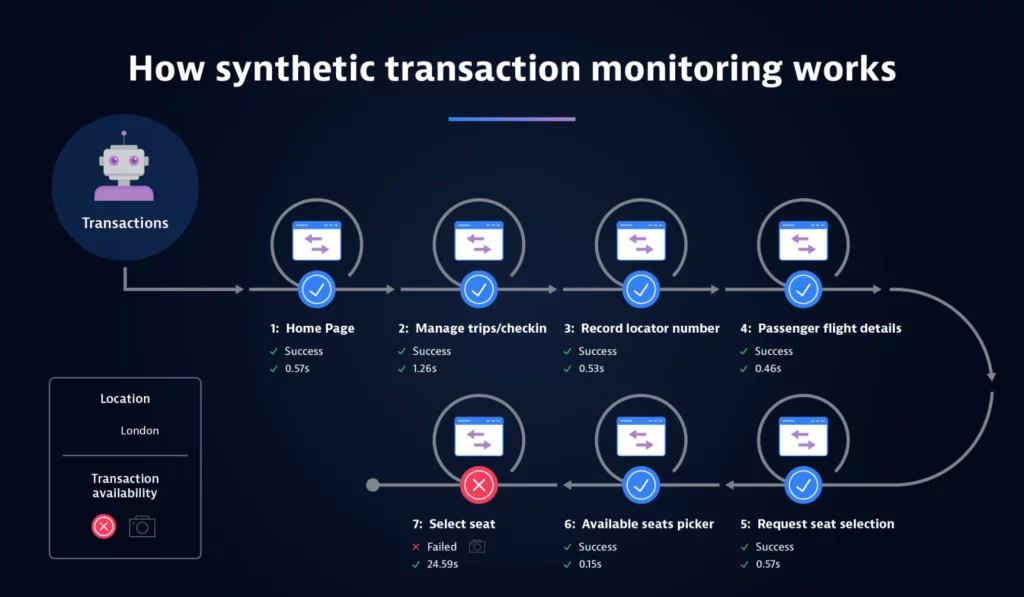

1. Observability Foundation
Modern observability is not a single tool, but a stack of complementary signals:
Infrastructure + Logs + APM + Synthetic + RUM
============================================
                Alerts + Dashboards
Role of Each Signal
| Layer | Purpose |
|---|---|
| Infrastructure Monitoring | CPU, memory, disk, network, nodes |
| Log Monitoring | Errors, warnings, audit trails |
| APM | Traces, service latency, dependencies |
| Synthetic Monitoring | Proactive availability & performance checks |
| RUM (Real User Monitoring) | Actual end-user experience |
👉 Synthetic Monitoring fills the proactive gap: it tells you something is broken before real users complain.
2. What Is Synthetic Monitoring?
Synthetic Monitoring is a technique where automated scripts simulate user or system behavior by sending requests to your application at regular intervals.
These scripts:
- Call endpoints
- Validate availability
- Measure performance
- Check correctness
Even if no real users are active, synthetic monitoring still runs.
3. Core Concept (From Your Notes)
SCRIPT  --->  ENDPOINT (API / HTTP / TCP / UDP)
                 |
              UP or DOWN?
Key Characteristics
- Script-driven
- Predictable execution
- Runs on schedule
- Independent of real traffic
4. What Can Synthetic Monitoring Test?
Supported Protocols
| Protocol | Use Case |
|---|---|
| HTTP / HTTPS | REST APIs, websites |
| API (REST / GraphQL) | Backend services |
| TCP | Database ports, SMTP, SSH |
| UDP | DNS, VoIP, streaming |
| ICMP | Basic reachability (ping) |
5. Types of Synthetic Monitoring
5.1 API / HTTP Synthetic Monitoring (No JavaScript)
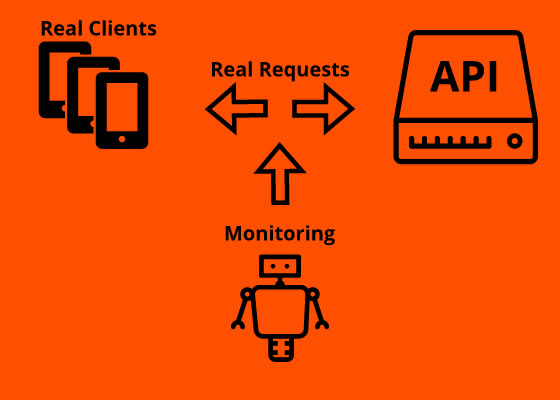
Characteristics
- Direct HTTP calls
- JavaScript not executed
- Lightweight and fast
- Ideal for backend checks
Typical Checks
- Status code (200/201/etc.)
- Response time
- Response body validation
- Headers and auth
- TLS handshake
Example
Client (Synthetic Agent) ---> HTTP API
                              |
                          JSON Response
5.2 Browser Synthetic Monitoring (JavaScript Executed)

Characteristics
- Uses a real browser
- Executes JavaScript
- Simulates real user behavior
- Heavier than API checks
Typical Scenarios
- Login flow
- Form submission
- SPA loading (React / Angular / Vue)
- Checkout journey
Example
Synthetic Browser ---> Load HTML ---> Execute JS ---> DOM rendered
6. Where Are Synthetic Scripts Hosted?
Script Hosting Model
=============================
SCRIPT hosted by Monitoring Platform
=============================
In tools like Dynatrace, scripts are:
- Centrally managed
- Versioned
- Secure
- Executed by managed agents
7. Global Execution Locations (15+ Regions)

Scripts run from multiple geographic regions:
USA   ---> API ---> Latency / Availability
INDIA ---> API ---> Latency / Availability
EU    ---> API ---> Latency / Availability
Why Global Locations Matter
- Detect regional outages
- Measure geo-latency
- Validate CDN behavior
- Catch ISP-specific issues
8. What Exactly Is Tested in a Synthetic Request?
From your notes:
https
  protocol
  load
  auth
    pass
    cert
    token
  body
  param
Detailed Breakdown
8.1 Protocol
- HTTP / HTTPS
- TLS version
- Cipher negotiation
8.2 Load & Performance
- DNS resolution time
- TCP connect time
- TLS handshake time
- Time to first byte (TTFB)
- Total response time
8.3 Authentication
| Type | Example |
|---|---|
| Basic Auth | Username + Password |
| Token | Bearer / OAuth / JWT |
| Certificate | mTLS |
| Custom Headers | API keys |
8.4 Request Body
- JSON
- XML
- Form data
- GraphQL payload
8.5 Parameters
- Query parameters
- Path variables
- Headers
9. Availability vs Performance
Synthetic Monitoring checks both:
| Aspect | Example |
|---|---|
| Availability | Endpoint reachable? |
| Performance | Response < 500ms? |
| Correctness | JSON field exists? |
| Security | TLS valid? |
10. Alerting & Dashboards
Alert Flow
Synthetic Failure
      ↓
Alert Rule Triggered
      ↓
Notification (Slack / Email / PagerDuty)
Dashboards Show
- Uptime %
- Response time trends
- Region-wise comparison
- Failure root causes
11. Synthetic vs RUM (Critical Difference)
| Synthetic Monitoring | RUM |
|---|---|
| Proactive | Reactive |
| Script-based | Real users |
| Controlled | Uncontrolled |
| Runs 24×7 | Runs when users exist |
👉 Best practice: Always use Synthetic + RUM together.
12. Common Use Cases
- API health checks
- Login page monitoring
- SSL certificate expiry checks
- Geo-availability validation
- Pre-release testing
- SLA / SLO verification
13. Best Practices
Design
- Keep scripts small and focused
- Separate API and browser checks
- Avoid unnecessary UI steps
Execution
- Run from multiple regions
- Use realistic authentication
- Set meaningful thresholds
Alerting
- Avoid alert storms
- Combine with APM context
- Alert on user-impacting failures
14. Synthetic Monitoring in Observability Strategy
Infra + Logs + APM + Synthetic + RUM
===================================
        Single Pane of Glass
Synthetic Monitoring acts as:
- Early warning system
- External viewpoint
- SLA guardian
15. Summary
Synthetic Monitoring:
- Uses scripts to test endpoints
- Works with HTTP, API, TCP, UDP
- Runs globally from managed regions
- Tests availability, performance, and correctness
- Complements APM and RUM
- Enables proactive incident detection
Recommended Comments
Join the conversation
You can post now and register later. If you have an account, sign in now to post with your account.